 Indiana Annual
Rainfall and Climate Data, see below for individual
cities
Indiana Annual
Rainfall and Climate Data, see below for individual
cities
Indiana Annual
Rainfall and Climate Data, see below for individual
cities
Indiana city precipitation totals
| City |
Avg Annual Precip |
Avg Annual Snowl |
Avg # days of Precip |
Avg # snow days |
Avg # thunderstorm days |
Avg # hail days |
Avg # severe thunderstorm watches per year | Avg # tornado watches per year | # of tornadoes reported in county, 1960-2010 |
| Evansville | 44.27 | 14.1 | 115 | 58 | 43 | 1 | 8 | 11 | 15 |
| Fort Wayne | 36.55 | 33.0 | 132 | 70 | 39 | 1 | 4 | 14 | 22 |
| Indianapolis | 40.95 | 23.9 | 126 | 58 | 43 | 1 | 5 | 12 | 35 |
| South Bend | 39.70 | 69.9 | 144 | 82 | 39 | 1 | 4 | 12 | 21 |
|
|||||||||
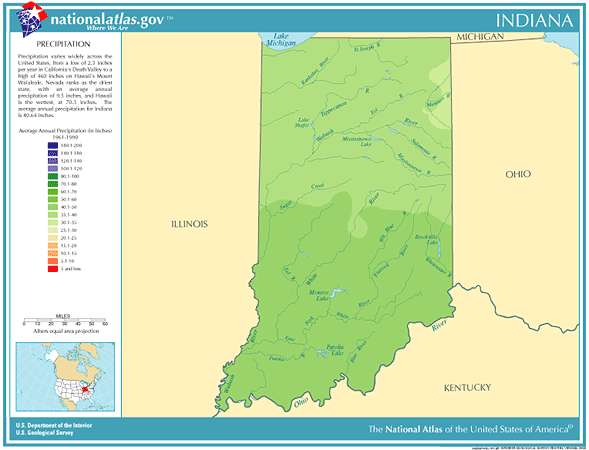
Indiana Precipitation Records
- Driest location ranked by lowest annual average precipitation: English, southern Indiana, 49.72"
- Wettest location ranked by highest annual average precipitation: Monroeville, northeast Indiana, 33.74"
- Snowiest location ranked by highest annual average snowfall: South Bend, northern Indiana, 76.6"
- State precipitation maximum for 24 hours - Princeton, southwest Indiana, 8/6/1905, 10.50"
- State precipitation maximum for 1 year - Marengo, southern Indiana, 1890, 97.38"
- State snow maximum for 24 hours - Seymour, south-central Indiana, 12/22-23/2004, 29.0"
- State snow maximum for 1 season - South Bend, northern Indiana, 1977-1978, 172.0"
- On 01/19/1987, a storm moving toward the northeastern U.S. produced up to 14 inches of snow in northern Indiana. Peru, Indiana received a foot of snow.
- Indiana temperature averages and extremes, Indianapolis climate extremes/averages, precipitation and temperature data for all U.S. states and Top 10 U.S. climate extremes
Data sources: National Climatic Data Center, severe thunderstorm / tornado watch data period is 1999 - 2008, NOAA Storm Prediction Center Tornado climate data - NOAA Storm Prediction Center
State lightning flash density average - 1997-2011, Vaisala